Energy Audit Tools and Equipment: Complete Instrument List, Uses and Cost in India
Every energy audit report is only as credible as the physical measurements underpinning it. Whether evaluating an energy-intensive industrial plant under the Bureau of Energy Efficiency (BEE) PAT scheme, conducting an Energy Conservation Building Code (ECBC) compliance audit, or performing a commercial walk-through, an auditor's conclusions cannot rely on nameplate estimates or facility assumptions.
This technical reference provides an exhaustive guide to energy audit tools and equipment used in the Indian field today: detailed operational physics, primary and derived measurement parameters, equipment specifications, buy-versus-rent economics, indicative 2026 Indian market prices, calibration governance, and an interactive site-visit checklist.
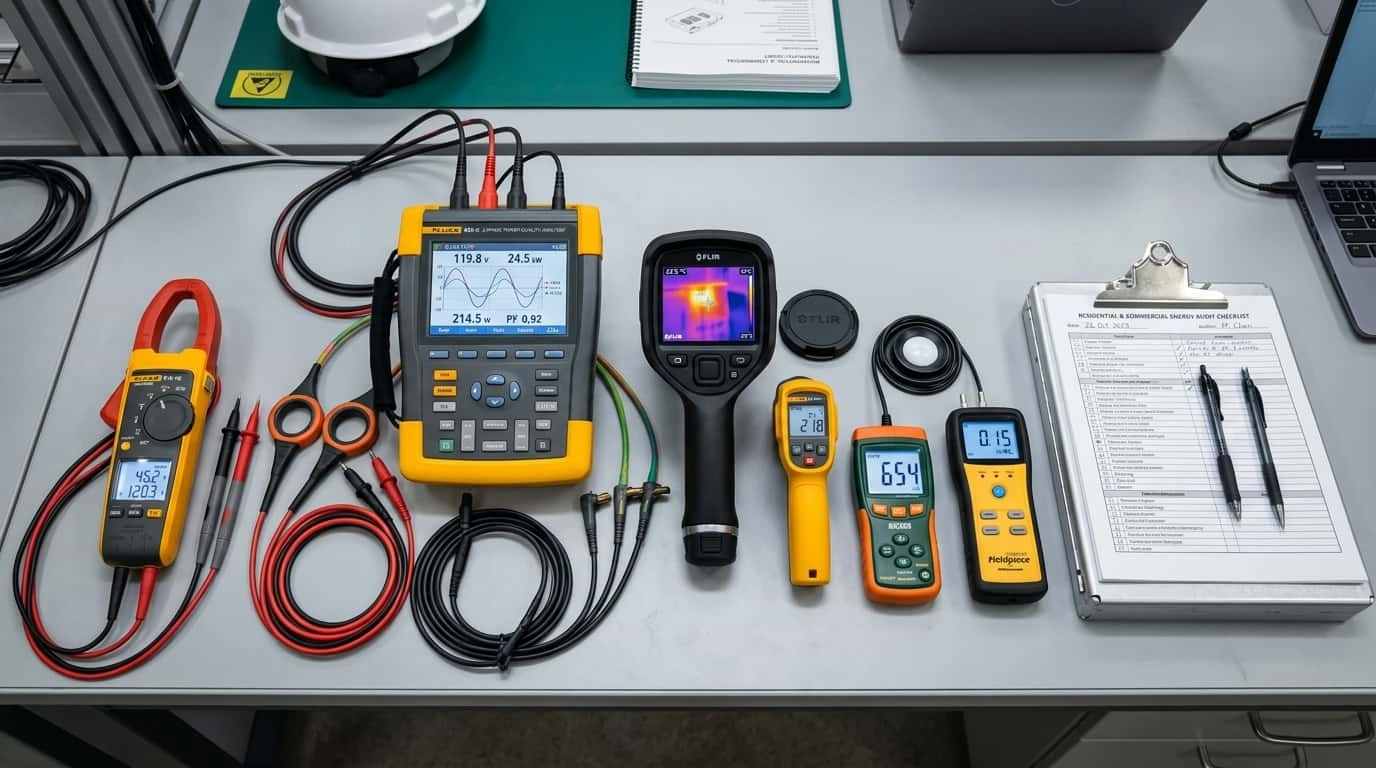
- What equipment is used in an energy audit? Energy audits employ portable diagnostic instruments spanning six primary disciplines: electrical measurement (True-RMS clamp meters, 3-phase power quality analysers), thermal diagnostics (infrared cameras, spot pyrometers), fluid & mechanical dynamics (ultrasonic flow meters, tachometers, pressure gauges, vibration meters), combustion & HVAC systems (flue gas analysers, anemometers, manometers), illumination (lux meters), and multi-channel logging software.
- Which instruments should a beginner acquire first? A starting auditor requires three foundational tools: a high-quality True-RMS digital clamp meter (CAT III/IV rated), a digital infrared thermometer with adjustable emissivity, and a cosine-corrected digital lux meter. These three tools cover 70% of preliminary audit observations at an entry cost under ₹15,000–₹25,000.
- Which instruments are essential for industrial versus building audits? Industrial audits mandate heavy power quality analysers, portable flue gas combustion analysers, ultrasonic flow meters for water/steam, and airborne ultrasonic leak detectors for compressed air. Building audits prioritize thermal imaging for envelope losses, vane/hot-wire anemometers, CO₂ indoor air quality monitors, and lux meters for lighting power density (LPD) verification under ECBC.
- How much does an energy auditor's toolkit cost in India? A beginner starter kit costs ₹15,000 to ₹40,000; an independent professional consultant kit ranges from ₹3,00,000 to ₹8,00,000; while an institutional or BEE-accredited audit firm lab suite ranges from ₹15,00,000 to over ₹35,00,000. High-capital instruments like ultrasonic flow meters and high-resolution thermal cameras are frequently rented per project.
- 1. What Is an Energy Audit Toolkit?
- 2. Complete Energy Audit Instruments Summary Table
- 3. Electrical Measurement Instruments
- 4. Thermal Imaging & Building Envelope Instruments
- 5. HVAC, Ventilation & Indoor Air Quality Tools
- 6. Combustion & Boiler Efficiency Instruments
- 7. Lighting Audit Instruments
- 8. Flow, Pressure & Mechanical Diagnostic Tools
- 9. Data Logging, Software & Solar-Related Tools
- 10. Essential Equipment by Facility & Industry
- 11. Interactive Energy Audit Site Visit Checklist
- 12. Technical Instrument Selection Matrix
- 13. Energy Audit Equipment Prices in India (2026)
- 14. Starter, Professional & Institutional Kit Configurations
- 15. How to Use Audit Instruments in the Field (10-Step Workflow)
- 16. Calibration, NABL Traceability & Maintenance Logs
- 17. Common Field Measurement Mistakes & Prevention
- 18. Illustrative Site Measurement Record Sheet
- 19. Frequently Asked Questions (FAQ)
- 20. Statutory Standards & Technical References
1. What Is an Energy Audit Toolkit?
An energy audit toolkit comprises specialized portable measurement, monitoring, and logging devices designed to quantify physical energy flows across electrical, thermal, chemical, and mechanical systems. In professional auditing practice, energy cannot be managed or conserved until it is accurately metered.
The primary role of the toolkit is to bridge the gap between engineering theory and operating reality. Facility operational data (such as logbooks and utility bills) often conceals localized phase imbalances, thermal radiation losses, duct air leakage, parasitic motor loads, or incomplete fuel combustion. Field instrumentation provides the empirical data necessary to establish an empirical Energy Baseline (EnB) and develop verifiable Energy Conservation Measures (ECMs) in accordance with Bureau of Energy Efficiency (BEE) methodologies and international standards such as ISO 50002 / IS 14489.
The Relationship: Measurement to Energy Baseline to Report
Every professional energy audit follows an empirical trajectory from sensor measurement to financial recommendation:
- Physical Parameter Capture: Instruments collect instantaneous or logged operational parameters (e.g., Amperes, Volts, Cos φ, Flue gas O₂ %, Surface °C, Static Pa, m/s air velocity).
- Baseline Energy Consumption (EnB): Logged data defines the baseline energy consumption under specific operating parameters, production throughput, or weather conditions.
- Efficiency Gap Quantification: Measured parameters are benchmarked against design specifications, theoretical thermodynamic maximums, or statutory standards (such as ECBC or BEE star benchmarks).
- Energy Conservation Measures (ECMs): Practical interventions (e.g., VFD retrofits, waste heat recovery, air leak elimination, burner tuning) are formulated with exact kWh, kVAh, or fuel saving projections.
- Measurement & Verification (M&V): Following project implementation, the same diagnostic tools verify real-world energy savings according to the International Performance Measurement and Verification Protocol (IPMVP).
Audit Types and Instrumentation Requirements
The depth of instrumentation deployed depends directly on the audit grade:
- Walk-Through / Preliminary Audit: Focuses on qualitative observation and rapid spot-checking. Relies on handheld, non-invasive instruments such as clamp meters, infrared spot thermometers, lux meters, and acoustic leak detectors. Loggers are rarely deployed.
- Targeted / Mini Energy Audit: Focuses on specific energy-intensive utilities (such as a boiler house, compressed air system, or chiller loop). Requires high-precision single-utility tools: portable flue gas analysers, ultrasonic water flow meters, or pressure drop manometers.
- Detailed Energy Audit (Investment-Grade Audit): Mandated for Designated Consumers (DCs) under the Energy Conservation Act, 2001 and PAT Scheme. Requires multi-channel synchronous data logging over representative production cycles (typically 3 to 7 days), 3-phase power quality monitoring, thermal imaging, continuous stack analysis, and detailed mass-energy balances.
2. Complete Energy Audit Instruments Summary Table
The following master matrix summarizes the core portable diagnostic instrumentation utilized in modern industrial, commercial, and institutional energy audits across India. Indicative prices reflect verified 2026 Indian market listings (excluding GST) for reputed industrial-grade equipment.
| Instrument Name | Primary Measurement | Typical Application | Recommended Facility / User | Priority | Indicative Price (INR) | Acquisition Strategy |
|---|---|---|---|---|---|---|
| True-RMS Clamp Meter | Current (A), Voltage (V), Continuity | Spot check load balance, feeder currents, cable capacity | All audits; Commercial, Residential, Industrial | Essential (P1) | ₹2,500 – ₹18,000 | Buy (Own) |
| Digital Multimeter (DMM) | AC/DC V, mV, Resistance, Frequency | Control circuit testing, sensor voltage verification | Electrical panels, automation systems | Essential (P1) | ₹1,800 – ₹12,000 | Buy (Own) |
| 3-Phase Power & Energy Analyser | kW, kVA, kVAr, PF, Harmonics, kWh | Main incoming feeder monitoring, motor efficiency profiling | Industrial plants, IT parks, Commercial towers | Essential (P1) | ₹75,000 – ₹3,50,000 | Buy / Rent |
| Power Quality Analyser (Class A) | Harmonics to 50th, THD-V/I, Transients, Dip/Swell | IEEE 519 compliance, VFD harmonic audit, transformer losses | Manufacturing, Process plants, Data centres | High (P2) | ₹2,50,000 – ₹7,50,000 | Rent / Institutional |
| Insulation Resistance Tester (Megger) | Insulation resistance (MΩ / GΩ), PI, DAR | Motor winding condition, underground cable health | Substations, rotating equipment, heavy motors | High (P2) | ₹8,000 – ₹45,000 | Buy (Own) |
| Earth Resistance Tester | Earth pit resistance (Ω), Soil resistivity | Substation safety, neutral grounding verification (IS 3043) | Industrial facilities, institutional campuses | Medium (P3) | ₹9,000 – ₹38,000 | Buy (Industrial) |
| Thermal Imaging Camera | Infrared thermography, ΔT radiation patterns | Switchgear hotspots, steam trap failures, building insulation | Electrical panels, furnaces, building envelope | Essential (P1) | ₹35,000 – ₹4,50,000 | Buy Entry / Rent Pro |
| Infrared Spot Thermometer | Surface temperature (°C / °F) via non-contact pyrometry | Rapid surface screening on pipes, ductwork, bearings | All facilities; screening preliminary audits | Essential (P1) | ₹1,500 – ₹10,000 | Buy (Own) |
| Flue Gas / Combustion Analyser | O₂, CO, CO₂, Flue Temp, Excess Air, Efficiency % | Boiler burner tuning, furnace combustion efficiency | Thermal process plants, textile, chemical, power | High (P2) | ₹55,000 – ₹3,20,000 | Buy (Core) / Rent |
| Digital Lux Meter | Illuminance (Lux / Foot-candles), cosine corrected | Lighting adequacy audits, Lighting Power Density (LPD) | Offices, commercial buildings, street lighting | Essential (P1) | ₹1,800 – ₹14,000 | Buy (Own) |
| Vane & Hot-Wire Anemometer | Air velocity (m/s), Volumetric flow (CFM / m³/h) | AHU duct air balancing, cooling tower airflow, exhaust fans | HVAC facilities, cleanrooms, commercial buildings | High (P2) | ₹4,500 – ₹32,000 | Buy (Own) |
| Digital Manometer (ΔP) | Differential pressure (Pa / mmWC / bar) | AHU filter loading, cleanroom pressure, duct static pressure | Commercial HVAC, industrial ducting systems | High (P2) | ₹6,000 – ₹28,000 | Buy (Own) |
| Clamp-On Ultrasonic Flow Meter | Liquid velocity (m/s), volumetric flow (m³/h, LPM) | Chilled water loop flow, boiler feed water, pump flow benchmarking | HVAC plants, chemical plants, water pumping stations | High (P2) | ₹65,000 – ₹4,50,000 | Rent / Institutional |
| Non-Contact Laser Tachometer | Rotational speed (RPM), surface linear speed (m/min) | Motor slip calculation, fan/pump pulley ratio verification | Motor-driven systems, belt drives, pumps, fans | Essential (P1) | ₹2,500 – ₹15,000 | Buy (Own) |
| Vibration Analyser (RMS / FFT) | Vibration velocity (mm/s), acceleration (g), displacement | Motor and bearing health, misalignment, mechanical loss | Heavy rotating equipment, turbines, large pumps | Medium (P3) | ₹30,000 – ₹3,50,000 | Rent / Industrial |
| Ultrasonic Compressed Air Leak Detector | High-frequency airborne ultrasound (38–42 kHz) | Detecting compressed air, vacuum, and steam leaks | Manufacturing plants, automobile factories, process units | High (P2) | ₹45,000 – ₹2,80,000 | Buy (Pro) / Rent |
| Multi-Channel Data Logger | Temperature, RH, 4-20mA, 0-10V, Modbus signals | Long-term temperature profiling, multi-day chiller performance | Continuous audits, HVAC baseline logging | High (P2) | ₹15,000 – ₹1,20,000 | Buy (Own) |
| Solar Irradiance Meter / Pyranometer | Solar flux (W/m²), cell temperature (°C) | Solar rooftop feasibility, PV Performance Ratio (PR) audits | Solar PV plants, rooftop solar assessments | Medium (P3) | ₹9,000 – ₹65,000 | Buy (Solar Auditors) |
3. Electrical Measurement Instruments
Electrical power accounts for 50% to over 85% of total energy consumption in commercial complexes and non-thermal manufacturing facilities. Before an auditor can recommend a variable frequency drive (VFD), power factor correction capacitor, or premium-efficiency motor (IE3/IE4), precise electrical measurement is mandatory.
3.1 True-RMS Digital Clamp Meter
₹2,500 – ₹18,000Operating Purpose: Enables non-invasive measurement of alternating and direct currents on live conductors without breaking the electrical circuit. Utilizes a split magnetic core (current transformer principle for AC) or Hall Effect sensor (for AC+DC).
True-RMS vs. Average-Responding: Conventional average-responding clamp meters calibrate their display to the RMS value of a pure sine wave (RMS = 1.11 × Average). In modern facilities dominated by non-linear loads (such as VFDs, LED drivers, UPS systems, and IT switching supplies), current waveforms are heavily distorted. An average-responding meter can produce measurement errors of 20% to 45%. A True-RMS instrument calculates the true heating effect by integrating the square of the instantaneous signal over time, making it non-negotiable for certified auditors.
3.2 Three-Phase Power & Energy Analyser
₹75,000 – ₹3,50,000Operating Purpose: Measures synchronous 3-phase voltages and currents across star (4-wire) and delta (3-wire) configurations to compute active power (kW), reactive power (kVAr), apparent power (kVA), displacement power factor (cos φ), true power factor (PF), and cumulative energy consumption (kWh/kVAh) over time.
Distinction Between Clamp Meter & Power Analyser: While a clamp meter provides a snapshot of instantaneous current at a single point in time, a power analyser integrates multi-phase phase angle relationships. You cannot calculate 3-phase real power (P = √3 × V × I × cos φ) accurately using a clamp meter alone unless you measure instantaneous phase angle φ on distorted waveforms. Power analysers record multi-day duty cycles, revealing peak demand penalties, load fluctuations, and unbalance.
3.3 Power Quality Analyser (PQA - Class A / Class S)
₹2,50,000 – ₹7,50,000Operating Purpose: Evaluates electrical grid anomalies, harmonic distortion, voltage dips/swells, unbalance, and flicker in accordance with IEC 61000-4-30 standard Class A protocols.
The Cost of Harmonics: Excessive harmonics lead to parasitic eddy current and hysteresis losses in distribution transformers, motor overheating, nuisance tripping of protective relays, and false metering readings. PQAs prove the economic return of Active Harmonic Filters (AHF) or detuned capacitor banks.
3.4 Insulation Resistance Tester (Megger) & Earth Resistance Tester
₹8,000 – ₹45,000 (Megger) | ₹9,000 – ₹38,000 (Earth)Operating Purpose:
- Insulation Resistance Tester: Applies high DC test voltages (250V, 500V, 1000V, 2.5kV, 5kV) to evaluate dielectric integrity of motor stator windings, cables, and busbars. Computes Polarization Index (PI = R10min / R1min) and Dielectric Absorption Ratio (DAR) to prevent catastrophic motor failure and insulation leakage.
- Earth Resistance Tester: Evaluates substation and panel grounding system resistance using the 3-pole Fall-of-Potential method and soil resistivity via 4-pole Wenner arrangement. Ensures compliance with IS 3043: Code of Practice for Earthing (neutral earth ≤ 1Ω for industrial substations).
All live electrical measurements on main distribution panels (PCC / MCC) present life-threatening hazards, including arc flash and electrocution. Energy auditors must adhere to NFPA 70E and IS 5216 safety standards:
- Instruments and test probes must be rated for the correct Measurement Category: CAT IV 600V at incoming service feeds, CAT III 1000V on downstream distribution panels. Never use CAT II domestic meters on three-phase switchgear.
- Wear appropriate Arc-Rated Personal Protective Equipment (PPE): Category 2 face shield (min. 8 cal/cm²), flame-resistant (FR) clothing, safety spectacles, and Class 0 insulated gloves tested to 1000V.
- Always perform the Three-Point Voltage Test when verifying de-energized circuits: Test known live source → Test target circuit → Retest known live source.
4. Thermal Imaging and Building Envelope Instruments
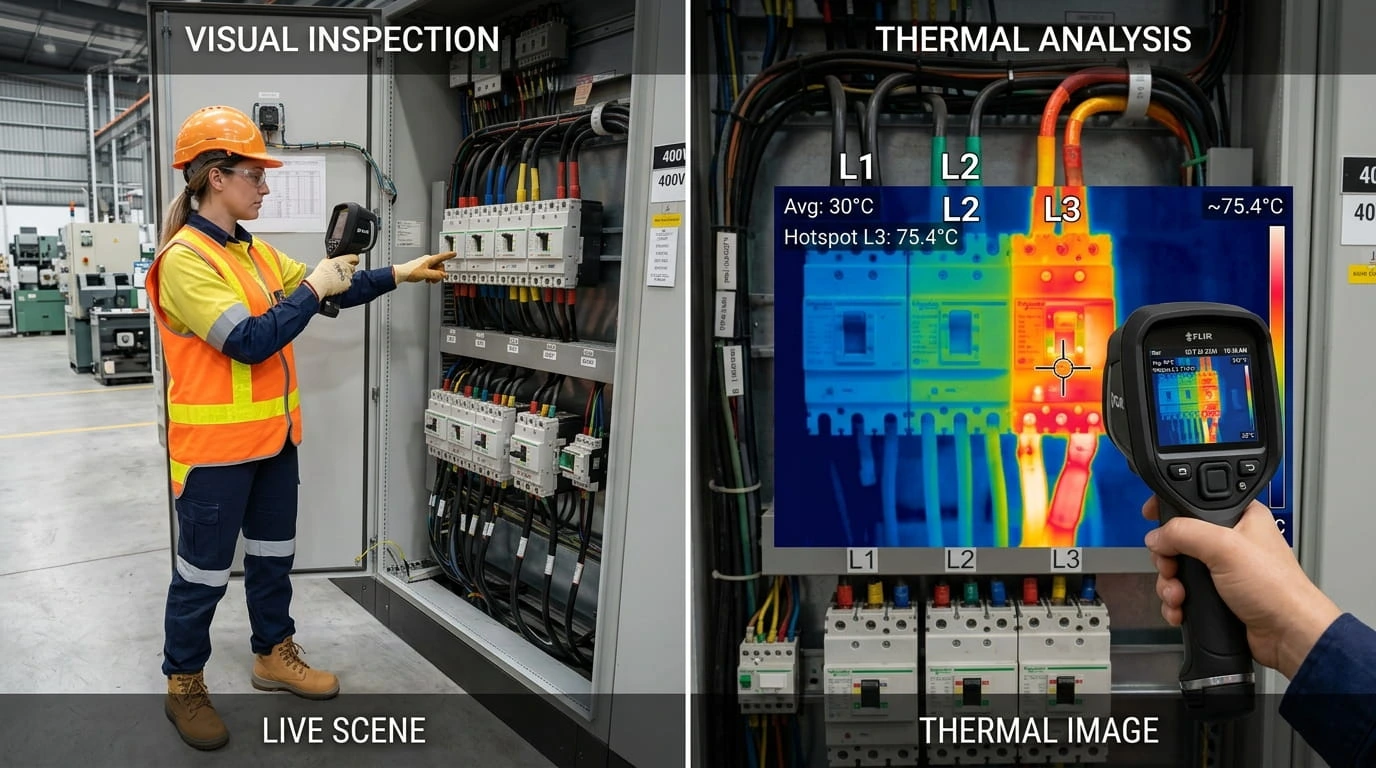
Thermal anomalies are the most direct visual indicator of energy dissipation. Conductor resistance, loose terminal lugs, refractory degradation in furnaces, steam trap leakage, and defective building wall insulation all reveal themselves through localized temperature gradients.
4.1 Thermal Imaging Camera (Infrared Thermography)
₹35,000 – ₹4,50,000Operating Purpose: Detects infrared radiation emitted by objects in the Long-Wave Infrared (LWIR) spectrum (7.5 to 14 μm) and converts surface radiance into calibrated, 2D temperature distribution heat maps.
Emissivity and Reflection Interpretation Pitfalls: Emissivity (ε) represents the efficiency with which a surface emits thermal radiation relative to a blackbody (0 ≤ ε ≤ 1.0). Untrained auditors frequently make serious diagnosis errors by aiming thermal cameras at polished metal surfaces (such as bare copper busbars, stainless steel piping, or galvanized sheet ductwork). Polished metals have low emissivity (ε ≈ 0.05–0.15) and high reflectivity. The camera registers reflected ambient heat from nearby lights or the auditor's body, rather than the conductor's actual temperature. For accurate thermography, auditors apply electrical vinyl tape (ε ≈ 0.95) or high-emissivity calibration spray to target surfaces before recording temperatures.
4.2 Infrared Spot Thermometer (Laser Pyrometer)
₹1,500 – ₹10,000Operating Purpose: Rapid single-point optical temperature measurement using a focused infrared sensor. Essential for quick temperature scans on overhead steam lines, motor bearing housings, and radiator fins.
Distance-to-Spot Ratio (D:S): An instrument with a 12:1 D:S ratio measures an optical circle of 100 mm diameter at a distance of 1200 mm. If the target object (e.g., a 25 mm pipe) is smaller than the spot size, the reading averages the pipe temperature with surrounding ambient air, resulting in substantial underestimation of surface heat.
4.3 Heat Flux Sensors & U-Value Measurement Systems
₹1,80,000 – ₹6,50,000 (Specialized / Rent)Operating Purpose: Direct in-situ measurement of heat transfer rate (W/m²) through building envelope assemblies (walls, roofs, fenestrations) to determine actual thermal transmittance (U-value, W/m²K) in compliance with ISO 9869 and ECBC 2017.
Measurement Conditions: In-situ U-value determination requires steady-state conditions with a sustained temperature difference (ΔT ≥ 10–15°C) between indoor conditioned space and outdoor ambient air, recorded continuously overnight over 72 hours. Spot checks cannot determine envelope compliance.
5. HVAC, Ventilation and Indoor Air Quality Instruments
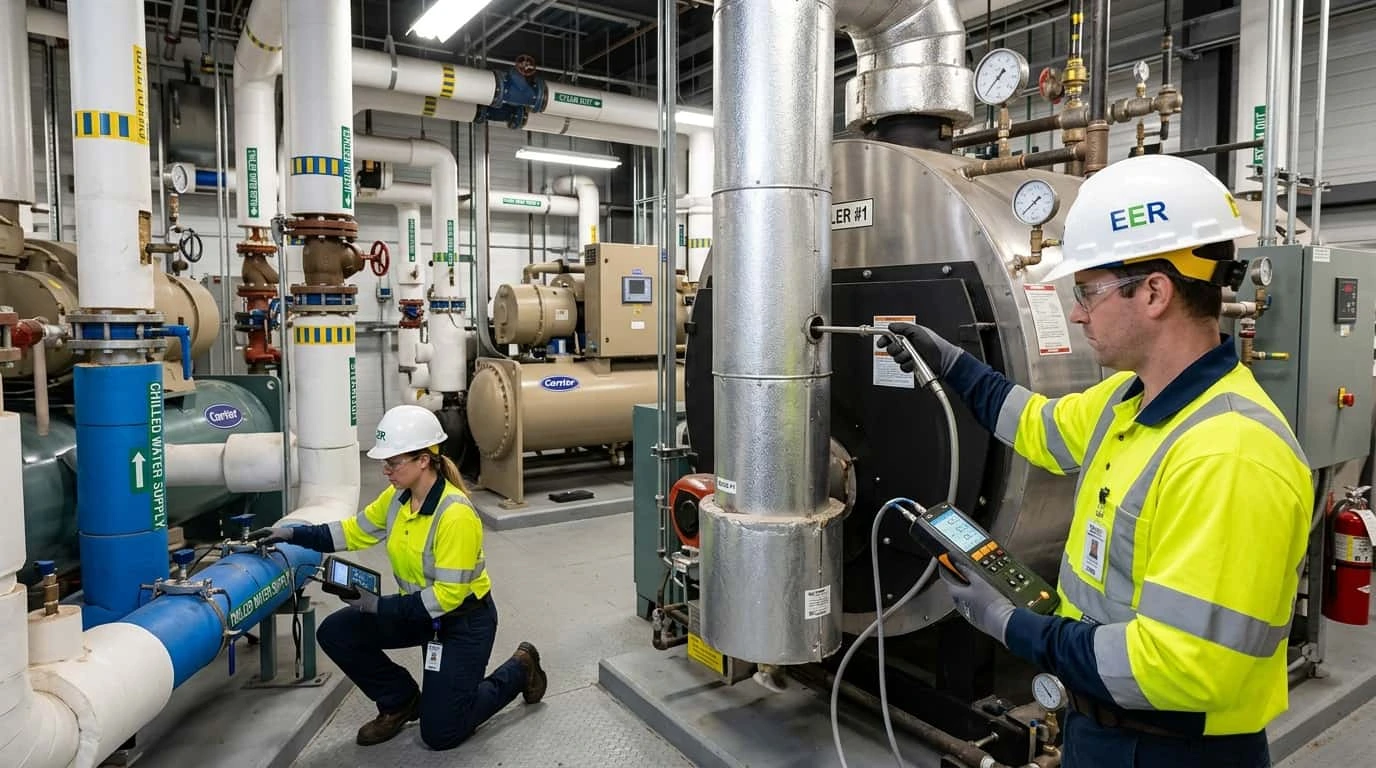
In commercial offices, hospitals, IT parks, and hotels across India, heating, ventilation, and air conditioning (HVAC) systems account for 40% to 65% of entire electricity consumption. Auditing HVAC performance demands accurate measurement of air movement, differential pressure, and thermodynamic properties.
5.1 Vane & Hot-Wire Anemometers
₹4,500 – ₹32,000Operating Purpose: Measures air velocity (m/s, FPM) and volumetric airflow (CFM, m³/h) across supply air ducts, return grilles, and cooling towers.
- Rotating Vane Anemometer (100mm / 16mm head): Ideal for measuring turbulent or non-uniform airflow across large grilles, diffusers, and cooling tower exhausts.
- Hot-Wire (Thermal) Anemometer: Employs a heated micro-filament cooled by airflow. Highly sensitive to low air velocities (0.05 to 5 m/s), making it ideal for duct interior traverses, laminar flow hoods, and draft assessment.
Log-Tchebycheff Duct Traverse: Measuring air velocity at a single centre point of a duct and multiplying by cross-sectional area produces up to 30% error due to boundary-layer friction. Auditors perform multi-point traverses according to the Log-Tchebycheff rule (min. 16 to 25 grid points in rectangular ducts).
5.2 Digital Differential Pressure Manometers
₹6,000 – ₹28,000Operating Purpose: Quantifies pressure differences across AHU air filters (EU3/EU4/HEPA), cooling coils, and supply/return fans. Used with Pitot-static tubes to derive air velocity via Bernoulli's equation (V = √(2ΔP / ρ)).
Energy Saving Metric: A clogged pre-filter causing an excessive 150 Pa pressure drop forces the supply fan to consume significant excess kWh. Regular manometer checks optimize filter replacement schedules based on static resistance rather than arbitrary calendar dates.
5.3 Indoor Air Quality (IAQ) & CO₂ Loggers
₹8,000 – ₹42,000Operating Purpose: Measures ambient indoor carbon dioxide concentration (ppm) using Non-Dispersive Infrared (NDIR) optical sensors alongside temperature and relative humidity.
Demand-Controlled Ventilation (DCV): Under ASHRAE 62.1 and National Building Code (NBC) 2016 guidelines, indoor CO₂ levels should remain below 1000 ppm. Levels below 600 ppm in commercial spaces indicate over-ventilation, where excessive hot/humid ambient air is being conditioned unnecessarily. Implementing CO₂-based DCV dampering yields 15% to 30% chiller energy reduction.
6. Combustion and Boiler Efficiency Instruments
Boilers, thermic fluid heaters, and industrial furnaces convert chemical energy into steam and thermal process heat. Because fuel costs represent 70% to 90% of total boiler lifecycle expenditure, even a 1.5% improvement in combustion efficiency translates into hundreds of thousands of rupees saved annually.
6.1 Portable Flue Gas Combustion Analyser
₹55,000 – ₹3,20,000Operating Purpose: Measures the volumetric composition of combustion exhaust gases extracted from boiler flue stacks using electrochemical and infrared sensors.
Tuning the Excess Air Sweet Spot: If excess air is too low, fuel remains unburned, producing soot and lethal carbon monoxide (incomplete combustion loss). If excess air is too high, heat is wasted heating excess air that exits through the chimney stack (dry flue gas loss). Optimal boiler tuning targets:
- Natural Gas: 2% – 3% O₂ (approx. 10% – 15% excess air)
- Furnace Oil / HSD: 3% – 4% O₂ (approx. 15% – 20% excess air)
- Coal / Biomass: 5% – 8% O₂ (approx. 30% – 60% excess air)
Siegert Formula Application: Modern analysers calculate stack loss using the empirical Siegert equation:
Where qA is sensible heat loss (%), and A1, B are fuel-specific combustion constants.
6.2 Steam System Diagnostic Instruments
₹25,000 – ₹1,80,000Operating Purpose: Detects failed-open and blowing steam traps that discharge live boiler steam into condensate recovery lines, wasting fuel and water treatment chemicals.
- Acoustic Ultrasonic Trap Tester: Translates high-frequency steam flow noise (20–40 kHz) into audible sound. A working trap cycles between holding and discharging; a failed trap produces a continuous rushing roar.
- Contact Surface Thermocouple Probe: Measures temperature drop (ΔT) across the trap. A failed-open trap shows negligible differential between inlet and discharge pipes.
7. Lighting Audit Instruments
Lighting retrofits represent one of the fastest payback energy conservation measures (typically 6 to 18 months). However, recommending lighting reductions without quantitative verification risks worker eye fatigue, safety hazards, and violation of statutory factory illumination codes.
7.1 Digital Lux Meter (Illuminance Meter)
₹1,800 – ₹14,000Operating Purpose: Measures incident light intensity per unit area (lumens/m² or Lux) across task work planes, corridors, and exterior facilities.
Indian Illumination Standards (IS 3646) & ECBC Compliance:
- General Storage / Corridors: 100 – 150 Lux
- General Office / CAD / Reading Workstations: 300 – 500 Lux
- Precision Engineering / Inspection Lines: 750 – 1500 Lux
Lighting Power Density (LPD, W/m²): Auditors calculate LPD by dividing total connected lighting circuit wattage by carpet area. The Energy Conservation Building Code (ECBC 2017) mandates maximum LPD limits (e.g., ≤ 9.5 W/m² for commercial offices). Combining lux meter verification with power logging identifies over-lit spaces suitable for delamping, task-ambient splitting, or daylight harvesting.
8. Flow, Pressure and Mechanical Diagnostic Tools
Electric motors drive pumps, compressors, fans, and conveyor systems, consuming over 70% of total electrical energy across Indian manufacturing facilities. Mechanical testing equipment assesses operating load, fluid transmission efficiency, and mechanical degradation.
8.1 Clamp-On Ultrasonic Liquid Flow Meter
₹65,000 – ₹4,50,000 (Rent Benchmark: ₹2,500 – ₹6,000/day)Operating Purpose: Non-invasively measures volumetric flow rate (m³/h, LPM) of liquids in closed pipes without cutting pipework or halting plant operations.
Prerequisites for Accurate Transit-Time Flow Measurement: Ultrasonic transit-time flow meters require a clean acoustic path through the pipe wall and liquid. Pipe scaling, internal corrosion, air bubbles, and improper acoustic couplant gel cause transducer signal loss. Critically, auditors must adhere to the Straight Pipe Run Rule: minimum 10 pipe diameters (10D) upstream and 5 pipe diameters (5D) downstream of elbows, valves, and reducers to ensure a fully developed, swirl-free flow profile.
8.2 Non-Contact Optical / Laser Tachometer
₹2,500 – ₹15,000Operating Purpose: Measures the rotational speed (RPM) of motor shafts, pulleys, fans, and pump impellers from a safe distance by reflecting an optical laser beam off a piece of retro-reflective target tape.
Motor Load Estimation via Slip Method: A standard 4-pole induction motor running on 50 Hz power has a synchronous speed (Ns) of 1500 RPM. If the motor nameplate states rated full-load speed is 1460 RPM (rated slip = 40 RPM), and the tachometer measures an actual running speed of 1485 RPM (actual slip = 15 RPM), the auditor estimates the motor is operating at approximately 37.5% load (15/40). Motors operating consistently below 40% load exhibit poor power factor and low operating efficiency, identifying them as candidates for down-sizing or VFD control.
8.3 Ultrasonic Compressed Air Leak Detector
₹45,000 – ₹2,80,000Operating Purpose: Detects airborne high-frequency turbulence (38 to 42 kHz) generated by compressed gas escaping through pipe cracks, hose fittings, quick-connects, and leaky valves. The instrument heterodyne-shifts ultrasound into audible frequencies heard through noise-attenuating headphones.
The Enormous Cost of Air Leaks: Compressed air is the most expensive industrial utility; only 10% to 15% of electrical input power turns into usable pneumatic work, with the remainder lost as heat. In an unmonitored factory, air leaks account for 20% to 35% of compressor output. A single 3 mm orifice leak at 7 bar pressure wastes roughly 3.1 kW of compressor power, costing over ₹1,60,000 annually in continuous operation.
9. Data Logging, Software and Solar-Related Audit Tools
Audits rarely occur under constant operating conditions. Load cycles vary by shift, ambient temperatures swing between day and night, and production throughput fluctuates. Multi-channel loggers and dedicated reporting tools convert thousands of data points into transparent, reproducible engineering reports.
9.1 Autonomous Multi-Channel Data Loggers
₹15,000 – ₹1,20,000Operating Purpose: Battery-powered recording modules that run unattended for days or weeks, capturing physical inputs (thermocouples, RTDs, 4-20mA process loops, 0-10V signals, or Modbus RS-485 outputs) at configurable time intervals (1 second to 1 hour).
Field Logging Rules:
- Time Synchronization: All deployed loggers, power analysers, and environmental meters must have internal clocks synchronized to GPS/IST before site deployment to correlate electrical spikes with thermal fluctuations.
- Sampling Interval: Set sampling interval according to load dynamics. Rapidly fluctuating loads (e.g., arc furnaces, injection moulding) require 1-second to 10-second intervals; chiller plants and boiler thermal cycles require 1-minute to 15-minute intervals.
9.2 Solar Irradiance Meter & Pyranometer
₹9,000 – ₹65,000Operating Purpose: Measures global horizontal irradiance (GHI) and plane-of-array (POA) solar irradiance in Watts per square meter (W/m²). Used when assessing rooftop solar PV feasibility or conducting performance audits on existing solar plants to calculate Performance Ratio (PR).
9.3 Audit Calculation Templates & Reporting Engines
Free / In-House to ₹60,000 (Commercial Software)Operating Purpose: Software platforms that ingest raw data logger outputs (CSV/Excel) and apply standardized thermodynamic and electrical equations to generate Sankey diagrams, energy balance sheets, and payback schedules compliant with BEE Form 1/2 reporting requirements.
10. Essential Equipment by Facility & Industry
No energy auditor carries every instrument to every audit. Equipment selection is tailored to the facility type, installed utilities, and primary energy cost drivers. The following sector matrix outlines core and specialized requirements across eight major Indian facility categories:
| Facility Type | Primary Energy Drivers | Core Instruments Deployed | Specialized Diagnostics |
|---|---|---|---|
| Commercial Offices & IT Parks | Central chiller plants, AHUs, Lighting, Server room UPS | Power Quality Analyser, Lux Meter, Hot-wire Anemometer, IR Thermometer | Ultrasonic Flow Meter (chilled water), Thermal Camera (envelope & server racks), CO₂ Monitor |
| Residential Buildings & Societies | Common lighting, lifts, water booster pumping, DG sets | True-RMS Clamp Meter, Lux Meter, Non-contact Tachometer | Pressure Gauge, Portable Power Analyser (pump motor profiling) |
| Heavy Manufacturing (Auto, Steel, Engg) | Electric motors, compressed air, arc furnaces, substations | Class A Power Quality Analyser, Ultrasonic Leak Detector, Thermal Camera, Megger | Vibration Analyser, Ultrasonic Flow Meter, Laser Shaft Alignment Tool |
| Process Industries (Textile, Pharma, Chemical) | Steam boilers, thermic fluid heaters, pumps, cooling towers | Flue Gas Combustion Analyser, Ultrasonic Flow Meter, Clamp Meter, Steam Trap Tester | High-temp Thermocouple probes, Vibration Analyser, Refractory Thermal Imager |
| Hotels, Hospitals & Campuses | HVAC chillers, hot water boilers, laundry steam, kitchen LPG, lighting | Power Analyser, Flue Gas Analyser, Lux Meter, Ultrasonic Flow Meter | CO₂ Indoor Air Quality Logger, Thermal Camera (cold storage & steam distribution) |
| HVAC-Intensive & Cold Storage | Refrigeration compressors, blast freezers, insulated cold rooms | Thermal Camera (insulation leaks), Power Analyser, Manometer, Data Loggers | Refrigerant Leak Detector, Multi-channel Temperature profiling tree |
| Water Supply & Sewage Pumping Stations | High-capacity centrifugal pumps, medium-voltage induction motors | Ultrasonic Flow Meter, True-RMS Clamp Meter, Pressure Transducers, Tachometer | Power Quality Analyser (harmonics on VFD pumps), Vibration Analyser |
| Solar PV Plants & Retrofit Sites | Solar modules, central/string inverters, transformer stepping | Solar Irradiance Meter, DC/AC Clamp Meter, Thermal Camera (cell hotspot scan) | I-V Curve Tracer, Insulation Resistance Tester (1000V DC) |
Master Field Diagnostic Instruments with Hands-On Practice
Theoretical knowledge alone does not produce a qualified energy auditor. Learn to connect, configure, log, and troubleshoot electrical power analysers, combustion analysers, thermal cameras, and flow meters through practical, industry-aligned training at IISE.
11. Interactive Energy Audit Site Visit Checklist
Use this interactive checklist to prepare, execute, and verify your equipment deployment before and during site assessments. Your selections persist automatically in your browser's local memory for on-site convenience.
Site Visit Equipment & Field Execution Checklist
-
Check battery charge on all handheld instruments and pack spare battery packs/chargersPower analysers, thermal cameras, and flue gas analysers consume battery rapidly.
-
Verify calibration validity dates and review calibration certificates in the instrument registerEnsure no critical meter has an expired NABL certificate.
-
Pack required Arc Flash PPE (Category 2/4 face shield, 1000V rated insulated gloves, safety boots)Mandatory before entering low/medium-voltage substation rooms.
-
Verify transformer incoming supply voltage balance across all three phases (<1% unbalance)Measure L-L and L-N voltages on main breaker.
-
Deploy 3-phase power analyser on primary incomer with Rogowski current coils correctly orientedArrow on current probes must point toward load to avoid negative power readings.
-
Record neutral conductor current on distribution panels feeding non-linear VFD/IT loadsTriplen harmonics (3rd, 9th) sum up in the neutral conductor.
-
Measure active power factor (PF) and compare with APFC capacitor panel target settingCheck whether bank is hunting or individual stages have blown fuses.
-
Conduct thermal sweep across PCC / MCC busbar joints, cable lugs, and circuit breaker contactsFlag any contact differential (ΔT) exceeding 15°C as priority hazard.
-
Inspect uninsulated steam lines, valves, flanges, and condensate piping using thermal imagingCalculate surface radiation and convective heat loss per meter.
-
Scan building envelope, window mullions, and roof insulation during maximum indoor-outdoor ΔTIdentify thermal bridging and air infiltration leakage paths.
-
Attach ultrasonic flow meter to chilled water header and record primary/secondary GPM/LPMVerify straight run: 10D upstream, 5D downstream from bends.
-
Measure chiller supply and return water temperatures with calibrated high-precision immersion probesCalculate actual thermal tonnage: TR = (LPM × ΔT °C) / 222.
-
Correlate electrical kW with thermal TR to derive operating specific power consumption (kW/TR)Benchmark against design rating (target <0.65 kW/TR for water-cooled chillers).
-
Measure air velocity duct traverse and static pressure drop across AHU coils and filtersCheck for excessive filter fouling (ΔP > 150 Pa).
-
Sample flue gases at boiler stack sampling port with portable combustion analyserRecord O₂ %, CO ppm, flue gas temperature, and ambient temperature.
-
Calculate dry flue gas heat loss and combustion efficiency under low-fire and high-fire statesCheck whether excess air burner dampers require recalibration.
-
Survey all operating steam traps using ultrasonic stethoscope and contact thermometerLog all blowing, leaking, or blocked traps with exact tag numbers.
-
Take grid-based task plane lux measurements across work zones at standard 0.75m working planeCompare against IS 3646 recommended task illuminance.
-
Measure rotational speed (RPM) with laser tachometer on critical pump/fan motorsDerive motor operating slip and estimate percentage operating load.
-
Conduct ultrasonic leak survey across complete compressed air piping networkTag every leak, estimate orifice size (dB level), and quantify CFM loss.
-
Cross-check that all logging devices successfully recorded data without memory buffer overflowDownload sample CSVs and inspect continuous timestamps.
-
Record baseline facility operational status: production tonnage, shift timing, ambient conditionsMeasurements are invalid without correlated production throughput records.
-
Remove all temporary probes, sensors, and magnetic voltage clips safelyRestore electrical panel doors, replace safety covers, and clear work permit.
-
Conduct preliminary exit debrief with facility plant head and obtain site sign-off logShare immediate critical safety hazards (e.g., severe thermal hotspots) immediately.
12. How to Select the Right Energy Audit Instruments
Procuring auditing equipment requires balancing measurement accuracy, field durability, and capital return. Investing in an institutional-grade Class A power quality analyser is uneconomic for an auditor doing primarily residential walk-throughs; conversely, relying on a basic handheld clamp meter for industrial PAT verification results in rejected audit submissions.
Critical Technical Selection Criteria
- Measurement Accuracy & Range: Ensure instrument accuracy is ≤±1.0% for power and energy, ≤±2% for temperature, and ±1–2% of reading for fluid flow. Verify measurement range covers anticipated site extremes (e.g., flue gas probes rated to ≥600°C).
- Safety Category Rating: Instruments connected to electrical busbars must carry genuine CAT IV 600V / CAT III 1000V certification stamped by accredited test bodies (UL, CE, CSA). Never purchase unbranded meters lacking internal high-energy ceramic fuses.
- Sensor Types & Ingress Protection (IP): Field environments are dusty, humid, and vibration-prone. Look for minimum IP54 water and dust ingress protection and drop-tested ruggedized casings.
- Data Logging Memory & Software Compatibility: Ensure instruments support open, non-proprietary data export (CSV, Excel) with onboard non-volatile memory sufficient for at least 7 days of continuous logging at 1-minute intervals.
- Calibration Traceability: Ensure the manufacturer or Indian distributor provides an initial calibration certificate traceable to national physical laboratories (NABL in India / NIST international).
Instrument Selection Matrix by Auditor Profile
| Auditor / Facility Profile | Budget Available | Core Purchase Priority | Recommended Rental Strategy |
|---|---|---|---|
| Student / Early-Career Trainee | ₹15,000 – ₹35,000 | True-RMS Clamp Meter, Digital Lux Meter, Infrared Thermometer | Rent nothing; utilize institute / employer equipment for advanced audits |
| Independent Energy Consultant (BEE Auditor) | ₹2,50,000 – ₹6,50,000 | 3-Phase Power Analyser, Entry Thermal Camera, Flue Gas Analyser, Laser Tachometer | Rent Ultrasonic Flow Meters, Class A PQAs, and high-res thermal cameras per assignment |
| Industrial Facility / Corporate ESCO / Lab | ₹15,00,000 – ₹35,00,000+ | Class A Power Quality Analyser, High-Res Thermal Imager, Dual-Channel Flow Meter, Multi-gas Stack Analyser | Own complete fleet with annual NABL calibration maintenance contracts |
13. Energy Audit Equipment Prices in India (2026)
Equipment costs in India depend heavily on brand reputation, accuracy classification, and whether items are sourced through domestic manufacturers (e.g., Krykard, Rishabh, Meco) or global diagnostic brands (e.g., Fluke, Testo, Hioki, Kyoritsu, FLIR). All pricing estimates below reflect verified 2026 Indian market listings (excluding 18% GST):
| Instrument Category | Entry-Level / Domestic (INR) | Mid-Range Professional (INR) | High-End / Global Brand (INR) | Daily Rental Cost (INR) |
|---|---|---|---|---|
| True-RMS Clamp Meter (AC/DC) | ₹2,500 – ₹5,000 | ₹6,000 – ₹12,000 | ₹15,000 – ₹28,000 | ₹300 – ₹600/day |
| 3-Phase Power & Energy Analyser | ₹65,000 – ₹1,20,000 | ₹1,50,000 – ₹2,40,000 | ₹2,80,000 – ₹4,80,000 | ₹1,500 – ₹3,500/day |
| Power Quality Analyser (Class A) | ₹2,20,000 – ₹3,20,000 | ₹3,50,000 – ₹5,00,000 | ₹5,50,000 – ₹8,50,000 | ₹3,000 – ₹7,500/day |
| Thermal Imaging Camera | ₹28,000 – ₹55,000 | ₹65,000 – ₹1,50,000 | ₹2,20,000 – ₹6,00,000+ | ₹1,200 – ₹3,500/day |
| Flue Gas Combustion Analyser | ₹48,000 – ₹75,000 | ₹95,000 – ₹1,80,000 | ₹2,20,000 – ₹4,20,000 | ₹1,800 – ₹4,000/day |
| Clamp-On Ultrasonic Flow Meter | ₹55,000 – ₹85,000 | ₹1,10,000 – ₹1,90,000 | ₹2,60,000 – ₹5,50,000 | ₹2,500 – ₹6,000/day |
| Digital Lux Meter | ₹1,500 – ₹3,500 | ₹4,500 – ₹8,500 | ₹10,000 – ₹18,000 | ₹200 – ₹400/day |
| Ultrasonic Leak Detector | ₹40,000 – ₹65,000 | ₹85,000 – ₹1,50,000 | ₹1,90,000 – ₹3,50,000 | ₹1,500 – ₹3,500/day |
Hidden Costs of Ownership: Calibration & Consumables
When budgeting for an audit toolkit, sticker purchase prices represent only part of total cost of ownership:
- NABL Calibration Fees: Annual calibration from an ISO/IEC 17025 accredited laboratory costs approximately ₹1,500 – ₹3,000 for clamp meters, ₹6,000 – ₹12,000 for 3-phase power analysers, and ₹8,000 – ₹15,000 for flue gas and flow equipment.
- Electrochemical Gas Sensor Replacements: Flue gas analyser O₂ cells degrade continuously through chemical exposure and require replacement every 18 to 24 months (approx. ₹8,000 – ₹18,000 per sensor).
- Consumable Accessories: High-temperature acoustic couplant gel for flow meters (₹1,500/tube), moisture filters for flue gas probes, and retro-reflective optical tachometer tape.
14. Starter, Professional and Institutional Auditor Kits
Rather than attempting to purchase every instrument simultaneously, successful energy auditors scale their equipment fleet systematically across three recognized tiers:
Starter Auditor Kit
- True-RMS Clamp Meter (CAT III/IV)
- Infrared Spot Pyrometer (D:S 12:1)
- Cosine-corrected Digital Lux Meter
- Contact/Non-contact Laser Tachometer
- Digital Multimeter with Temp probe
- No 3-Phase Power Analyser
- No Thermal Imaging Camera
- No Flue Gas / Flow Meters
Upgrade Path: Rent power analysers or thermal cameras as commercial walk-through projects convert into paid detailed audits.
Professional Auditor Kit
- Everything in Starter Kit
- 3-Phase Power & Energy Analyser
- Handheld Thermal Camera (160×120+)
- Portable Flue Gas Combustion Analyser
- Digital Vane/Hot-wire Anemometer
- Digital Differential Manometer (ΔP)
- 5kV Insulation Resistance Tester
- Ultrasonic Flow Meter (Rented per project)
Strategic Balance: Covers 90% of industrial and commercial audit assignments with strong commercial return.
Institutional / ESCO Lab
- Class A Power Quality Analysers (Multi-feeder)
- High-Resolution Thermal Imager (640×480)
- Dual-Channel Ultrasonic Liquid Flow Meter
- Multi-Gas Flue Analyser (O₂, CO, NO, SO₂)
- Ultrasonic Airborne Leak Detector
- Vibration Analyser with FFT Spectrum
- Multi-Channel Temperature/Pressure Trees
- Annual NABL Calibration Retainership
Target Scope: Full compliance audits for Designated Consumers (DCs) under national PAT schemes.
15. How to Use Energy Audit Instruments Correctly
Collecting reliable data in demanding industrial environments requires a disciplined, repeatable field procedure. Follow this 10-step workflow on every diagnostic assessment:
- Define the Measurement Objective & Data Plan: Never take measurements aimlessly. Define the specific engineering question first (e.g., "Is Transformer #2 running with excessive phase imbalance?" or "What is the combustion efficiency of Boiler #1 on 60% load?").
- Review Equipment Manuals & Safety Requirements: Inspect meter ratings, input limits, and battery charge status before departing for site. Verify site permit requirements (Hot Work permits, Electrical Isolation permits).
- Inspect Equipment Condition & Test Leads: Visually inspect insulation on voltage leads, current clamps, and thermocouples. Check for cracked housings or frayed insulation. A nicked lead on a 415V busbar can trigger an arc flash.
- Document Equipment Identification & Measurement Location: Record meter model, serial number, calibration certificate date, and exact measurement point on the single-line diagram (SLD).
- Establish Baseline Operating Conditions: Verify that the target equipment is operating under representative production load. Do not record chiller or boiler performance during system warm-up, cleaning, or idling shifts.
- Execute Measurement Using Correct Technique: Center conductors within clamp meter jaws. Maintain perpendicular orientation for infrared pyrometers. Ensure adequate straight-pipe runs for flow meters.
- Record Exact Units, Timestamps & Range Settings: Record instantaneous values alongside exact engineering units (kW vs. kVA, gauge bar vs. absolute bar, Nm³/h vs. m³/h). Note IST timestamp.
- Cross-Check with Secondary Indicators: Validate portable meter readings against panel-mounted switchboard meters or SCADA screens. Investigate significant discrepancies immediately.
- Identify & Investigate Anomalies: If a reading diverges sharply from theoretical expectations, verify instrument connections, sensor contact, and operating parameters before accepting the result.
- Export Data & Secure Field Records: Download data loggers immediately upon test completion. Back up raw CSV files to a secondary drive and secure client site sign-off.
16. Calibration, Accuracy and Maintenance
An uncalibrated instrument produces unverified numbers that fail to withstand technical scrutiny during BEE verification or client investment reviews. As sensors age, component tolerance drifts and environmental exposure degrade measurement fidelity.
Understanding Calibration Certificates & NABL Traceability
In India, credible energy audit reports require instruments calibrated by testing laboratories accredited by the National Accreditation Board for Testing and Calibration Laboratories (NABL) under ISO/IEC 17025. When reviewing a calibration certificate, auditors must inspect three elements:
- Expanded Uncertainty: The laboratory must state the measurement uncertainty (e.g., ±0.25% at 95% confidence level, k=2). If the uncertainty exceeds your required audit tolerance, the meter is unsuitable.
- As-Found vs. As-Left Data: Indicates whether the meter was within specification when received ("As-Found") or required adjustment ("As-Left"). If significant deviation existed, prior audit reports may require review.
- Traceability Chain: The certificate must cite the primary reference standards maintained by the National Physical Laboratory of India (NPL) or international equivalents.
Sample Instrument Maintenance & Calibration Log
| Asset Tag | Instrument Model | Serial No. | Last Calibration | Next Due Date | Calibrating Body | Status |
|---|---|---|---|---|---|---|
| IISE-EE-01 | Fluke 435-II Power Quality Analyser | FLK-928104 | 14-Jan-2026 | 13-Jan-2027 | NABL Lab #CC-2410 | Active |
| IISE-TH-04 | FLIR E8-XT Thermal Imager | FLR-772910 | 08-Mar-2026 | 07-Mar-2027 | NABL Lab #CC-1892 | Active |
| IISE-CB-02 | Testo 350 Flue Gas Analyser | TST-441098 | 19-Nov-2025 | 18-Nov-2026 | Authorized OEM Lab | Due Soon |
| IISE-FL-01 | Flexim F601 Ultrasonic Flow Meter | FLX-102944 | 22-Feb-2026 | 21-Feb-2027 | NABL Lab #CC-3115 | Active |
17. Common Field Measurement Mistakes & Prevention
Even seasoned engineers encounter measurement traps in complex plant environments. Avoid these eight recurring pitfalls:
The Mistake: Recording transformer or chiller loading during a weekend maintenance shift, lunch break, or seasonal low-demand period and extrapolating annual savings from that baseline.
Prevention: Always consult production logs and verify throughput rate before logging. Require minimum 72-hour to 7-day logging across full three-shift production cycles.
The Mistake: Connecting standard clamp meters to the Pulse Width Modulated (PWM) variable frequency drive output to measure motor current.
Prevention: Standard meters read high-frequency carrier switching noise, producing errors up to 50%. Use True-RMS instruments equipped with a Low-Pass VFD Filter (cutoff at 50/60 Hz fundamental).
The Mistake: Aiming an infrared thermometer or thermal camera at bare unpainted steam piping and concluding the surface is cool because the reading indicates only 45°C.
Prevention: Bare metals reflect background thermal radiation. Apply high-emissivity black vinyl tape (ε=0.95) or contact surface thermocouple probes to capture true skin temperature.
The Mistake: Holding an anemometer at the center of an AHU supply grille for three seconds and multiplying that speed by grille area to compute CFM.
Prevention: Air velocity profiles across ducts and grilles are highly non-uniform. Conduct structured multi-point Log-Tchebycheff traverses (min. 16 grid points) or use calibrated capture hoods.
The Mistake: Observing an air compressor unloading down to 10 kW and assuming it consumes 10 kWh over every operating hour.
Prevention: Cyclical loads cycle between load, unload, and idle states. Integrate continuous power logging over time to derive true kWh consumption rather than multiplying spot kW by operating hours.
The Mistake: Clamping ultrasonic transducers directly after a pipe elbow or throttle valve, resulting in swirling flow patterns, acoustic signal attenuation, and severe reading drift.
Prevention: Strictly adhere to straight run requirements: minimum 10 pipe diameters upstream and 5 pipe diameters downstream of any disturbance.
The Mistake: Inserting a cold flue gas probe into a high-moisture exhaust stack without checking the water trap, flooding electrochemical cells with condensed acidic moisture.
Prevention: Always ensure condensation traps and particulate filters are empty and properly seated. Purge gas sensors with fresh ambient air before and after every combustion test.
The Mistake: Claiming an energy conservation measure will save 20% electricity based solely on vendor marketing brochures, without establishing normalized baselines.
Prevention: Correlate energy consumption against driving independent variables (e.g., cooling degree days for HVAC, production tonnes for manufacturing) using linear regression analysis.
18. Illustrative Site Measurement Record Sheet
All field measurements must be documented in structured logs during site walk-throughs. The following illustrative table demonstrates a professional field observation record sheet:
| Time | Location / Equipment Tag | Instrument Used | Parameter | Measured Value | Unit | Operating State | Observation & Potential ECM |
|---|---|---|---|---|---|---|---|
| 10:15 | Main Substation Incomer TR-01 | Fluke 435-II PQA | Active Power / PF | 412 kW / 0.84 PF | kW / — | Normal Production | Low PF; APFC Stage 3 defective. Penalty risk on tariff. |
| 11:00 | MCC Panel #4 Feeder F-08 | FLIR E8-XT Camera | Contact Temperature | 78.5 °C (ΔT = 38°C) | °C | Full Load (Pump Running) | Severe thermal hotspot on Phase B lug. Immediate maintenance hazard. |
| 11:45 | Boiler #02 Exhaust Flue | Testo 350 Analyser | Flue O₂ / Stack Temp | 7.8% O₂ / 218 °C | % / °C | High Fire (65% Steam) | High excess air (λ=1.59); burner damper requires tuning. |
| 14:20 | Chiller Plant Header CH-01 | Flexim F601 Flowmeter | Chilled Water Flow | 1,420 LPM (ΔT 4.2°C) | LPM | 100% Chiller Load | Operating specific power = 0.78 kW/TR. Benchmark is 0.62 kW/TR. |
| 15:30 | Shopfloor Compressor Line C-03 | SDT 270 Ultrasound | Airborne Ultrasound | 68 dBµV (40 kHz) | dBµV | Normal Operation | Major 4mm air leak at quick disconnect. Estimated 4.8 kW loss. |
| 16:45 | Drafting Office 2nd Floor | Testo 540 Lux Meter | Task Illuminance | 185 Lux | Lux | Daytime Working | Under-lit compared to IS 3646 requirement (300 Lux). High glare. |
Note: Readings above are illustrative engineering samples demonstrating standard field recording protocol.
19. Frequently Asked Questions (FAQ)
The Bureau of Energy Efficiency (BEE) does not mandate a single rigid hardware list for every audit; rather, it prescribes statutory measurement guidelines under the Energy Conservation Act, 2001 and PAT Rules. Certified Energy Auditors must be equipped to accurately quantify electrical parameters (via True-RMS power analysers), thermal efficiency (via combustion flue gas analysers and infrared cameras), and utility distribution metrics (via ultrasonic flow meters and manometers) relevant to the audit scope and facility boundaries.
The five indispensable tools that form the core of every working auditor's field kit are: (1) A True-RMS digital clamp meter (CAT III/IV rated) for non-invasive current and voltage checks; (2) An infrared spot pyrometer with adjustable emissivity for surface temperature screening; (3) A cosine-corrected digital lux meter for illumination audits; (4) A non-contact laser tachometer for motor speed and slip calculation; and (5) A digital multimeter for precision voltage and continuity verification. These five tools resolve the majority of walk-through audit observations at minimal upfront cost.
Active electrical power consumption (in kilowatts, kW) and cumulative energy consumption (in kilowatt-hours, kWh) are measured using a Three-Phase Power and Energy Analyser. While a basic clamp meter measures instantaneous current, a power analyser synchronously samples multi-phase voltages and currents, accounts for the phase angle (power factor, cos φ), and integrates power over time across both sinusoidal and distorted waveforms.
A clamp meter is a handheld tool designed primarily for quick, single-conductor instantaneous current and voltage spot checks. It cannot measure phase-to-phase angular relationships, harmonics, or cumulative energy over time. In contrast, a power analyser features multiple voltage and current channels, records 3-phase active, reactive, and apparent power simultaneously, computes total harmonic distortion (THD), and logs long-term load curves and demand profiles over multiple days or weeks.
Industrial audits require heavy diagnostic capability: 3-phase power quality analysers (for transformer and motor feeders), portable flue gas combustion analysers (for boilers and furnaces), clamp-on ultrasonic flow meters (for chilled water and process pipelines), airborne ultrasonic leak detectors (for compressed air and vacuum networks), high-voltage insulation testers (for motor health), and thermal imaging cameras (for electrical switchgear and refractory losses).
Building energy audits under ECBC norms focus on HVAC, envelope, and lighting: thermal imaging cameras (for building envelope heat gain and glazing leaks), vane and hot-wire anemometers (for duct airflow and ventilation balancing), digital differential manometers (for filter pressure drops), indoor CO₂ monitors (for demand-controlled ventilation), digital lux meters (for Lighting Power Density compliance), and ultrasonic flow meters (for central chiller plant water flow benchmarking).
In the Indian market, toolkit investment scales across three distinct tiers: a Starter Kit (clamp meter, lux meter, IR thermometer, tachometer) costs between ₹15,000 and ₹40,000; a Professional Kit (including a 3-phase power analyser, entry thermal camera, and flue gas analyser) ranges from ₹3,00,000 to ₹8,00,000; and an Institutional / ESCO Lab suite (including Class A PQAs, ultrasonic flow meters, and high-resolution thermal imagers) costs between ₹15,00,000 and ₹35,00,000+.
A hybrid approach is strongly recommended. Early-career auditors should buy low-cost, frequently used instruments upfront (True-RMS clamp meter, lux meter, IR pyrometer, multimeter) for under ₹25,000. High-capital instruments—such as clamp-on ultrasonic flow meters (₹1.5L–₹4L+), Class A power quality analysers (₹3L–₹7L+), and high-resolution thermal cameras—should be rented per project until regular audit billing volume justifies full ownership.
Most electrical and thermal instruments (clamp meters, power analysers, thermal cameras, lux meters) require annual calibration from an ISO/IEC 17025 (NABL) accredited laboratory. However, calibration intervals are not universal: combustion flue gas analysers require sensor zero-calibration before every test and electrochemical cell recalibration or replacement every 12 to 18 months due to sensor degradation. Instruments subjected to physical shock, severe thermal cycling, or high-humidity field use must be recalibrated immediately.
While an infrared spot pyrometer is sufficient for simple single-point temperature checks, a true thermal imaging camera is indispensable for comprehensive electrical and thermal audits. It detects dangerous loose electrical busbar joints, phase unbalance, steam trap failures, damaged refractory linings, and building envelope thermal bridges that are completely invisible to the naked eye or point pyrometers. It provides visual, unquestionable photographic evidence in client reports.
Boiler efficiency assessment by the Indirect Method (as per BS 845 / IS 8753) requires: (1) A portable flue gas analyser to measure stack O₂, CO, flue gas temperature, and ambient temperature; (2) An ultrasonic liquid flow meter or calibrated water meter to measure boiler feedwater flow; (3) Contact thermocouple probes to measure steam line and condensate recovery temperatures; (4) A thermal camera to evaluate shell radiation and convection losses; and (5) Draft manometers to evaluate balanced draught across combustion zones.
Auditors must maintain a formal Instrument Master Register containing: asset tags, make, model, serial number, date of purchase, NABL calibration certificates, expanded measurement uncertainty, calibration due dates, battery service logs, and maintenance records. In statutory PAT compliance audits and accredited BEE assessments, assessors routinely verify equipment calibration traceability before accepting submitted energy conservation figures.
Statutory Standards, Guidelines and Technical References
- Bureau of Energy Efficiency (BEE), Ministry of Power, Government of India: Energy Conservation Act, 2001 & National Certification Examination for Energy Auditors. beeindia.gov.in
- Bureau of Indian Standards (BIS): IS 14489:1998 – Code of Practice on Occupational Safety and Health Audit; IS 3043:2018 – Code of Practice for Earthing; IS 3646 – Code of Practice for Interior Illumination.
- Bureau of Energy Efficiency: Energy Conservation Building Code (ECBC 2017) – Technical guidelines for commercial and institutional building envelopes, lighting, and HVAC systems.
- International Organization for Standardization: ISO 50002:2014 – Energy audits: Requirements with guidance for use; ISO/IEC 17025:2017 – General requirements for the competence of testing and calibration laboratories.
- Efficiency Valuation Organization (EVO): International Performance Measurement and Verification Protocol (IPMVP) – Standards for quantifying energy conservation measure (ECM) savings.
Related Energy Auditing Guides & Career Pathways
How to Become a BEE Certified Energy Auditor in India
Complete roadmap to eligibility criteria, Paper 1–4 examination structure, passing criteria, and preparation strategy for aspiring Energy Auditors.
Read Guide →Industrial Energy Audit Process, Checklist & Report Format
A deep dive into industrial audit execution, pre-audit data collection, detailed plant walkthroughs, and investment-grade report structuring in India.
Read Guide →What Is an Energy Audit? Types, Process & Benefits
Explore the fundamentals of walk-through, preliminary, and investment-grade energy audits, along with their commercial and environmental returns.
Read Guide →PAT Scheme in India: Role of Energy Auditors
Understand Perform, Achieve and Trade compliance requirements for Designated Consumers and how certified auditors conduct mandatory verification.
Read Guide →Build Your Skills Before You Buy Your Toolkit
Purchasing diagnostic instruments without formal training in measurement physics and report formulation is a recipe for costly errors. Join IISE's comprehensive training programs to gain hands-on proficiency across every instrument covered in this guide.